1
2
3
4
5
6
7
8
9
10
11
12
13
14
15
16
17
18
19
20
21
22
23
24
25
26
27
28
29
30
31
32
33
|
import cv2
from numpy import mgrid, sum
from matplotlib import pyplot as plt
# Variable #
ImageSum=0
cX=0
cY=0
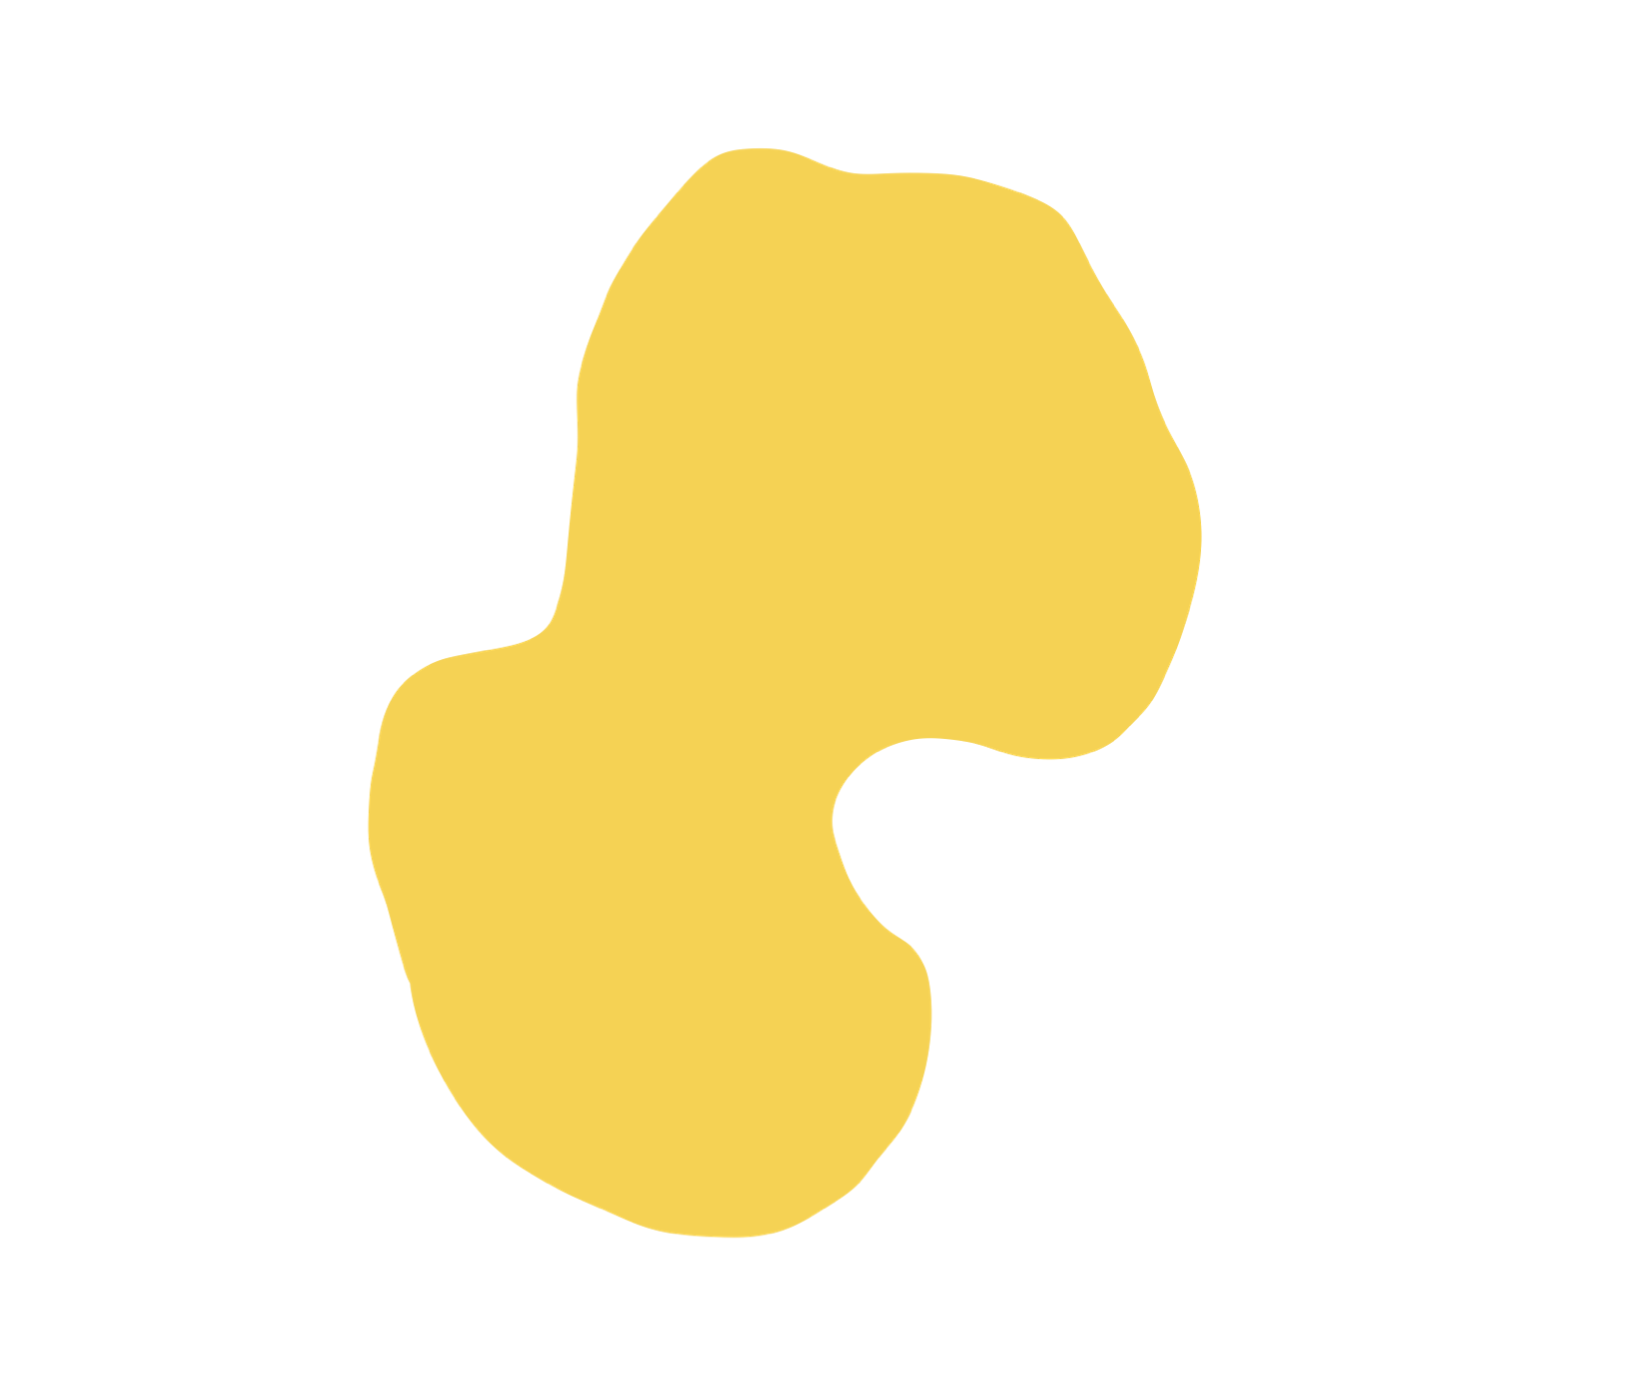
img = cv2.imread("Image.png")
gray = cv2.cvtColor(img, cv2.COLOR_BGR2GRAY) # GrayScale
height, width = gray.shape
ret, dst = cv2.threshold (gray, 254, 255, cv2.THRESH_BINARY_INV) # 이진화
for i in range(height):
for j in range(width):
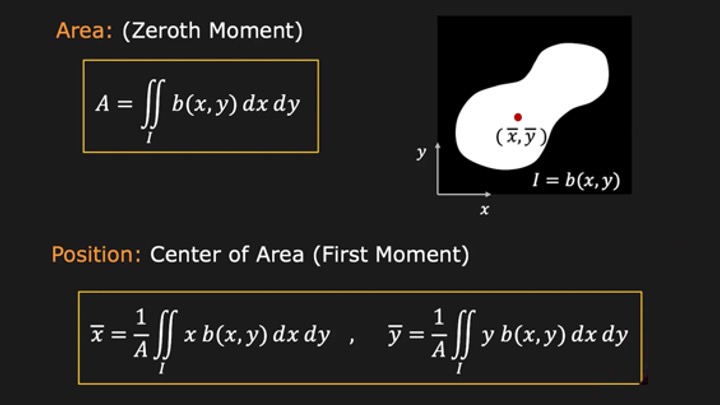
ImageSum+=dst[i][j] # Image Area( Zero Moment )
for i in range(height):
for j in range(width):
cX+=(j*dst[i][j])
cY+=(i*dst[i][j])
# Center of Area ( First Moment )
cX/=ImageSum # Center of Area (cX)
cY/=ImageSum # Center of Area (cY)
cv2.circle(dst,((int)(cX),(int)(cY)),3,(0,0,255),-1)
cv2.imshow("original",img)
cv2.imshow("thres",dst)
|